Over a year ago I started experiencing nerve pain in my right arm. At the time I thought it was simple carpel tunnel, or cubital tunnel, some kind of tunnel. I wore braces at night, but the pain got worse. I went to my GP who told me it was probably just carpel tunnel and to wear braces and take ibuprofen.
The pain continued. We sold our house and moved. I got set up with a new doctor who ultimately identified an issue with my neck. More tests showed arthritis had made it in-between my cervical discs.
God forbid I be normal about this.
I knew there was some relation between the weather and arthritis – I had grown up with all the old people around me predicting the weather based on pain. I learned that it had something to do with barometric pressure. I wanted to track my pain but every app I had included a hundred other features you had to wade through to get to logging. There was no “just click a button” app that wasn’t either filled with ads or required a lot more input (like what you ate, how you feel emotionally, etc). I already had hosting and a couple domains, so I cracked open Claude (at the time, just the chats/projects in browser – I didn’t have the Claude Code app yet) and had it build me a basic webapp.
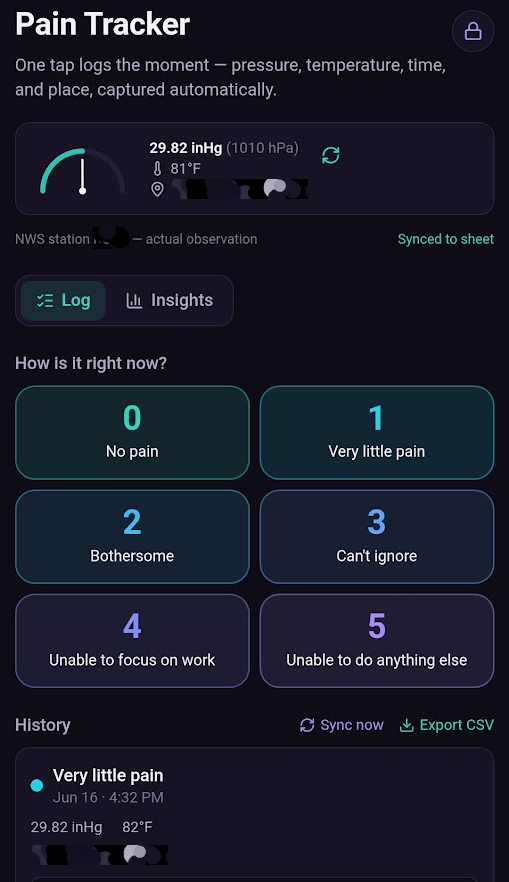
I wanted to get an idea of what the barometric pressure was when I had pain, including the temperature, date, and time. The first go ended up getting pressure from a predictive analysis site, which was not ideal – I wanted actual readings. This image is from the second or third version. The first one I felt was truly usable. I set pain levels that made sense to me, and would simply open the app, and click on the one that matched in the moment, building a log over time, logged in a google sheet on my google drive.
This was going well for a while. The insights tab gave me a few charts to show pain over time, with a throughline for barometric pressure. I learned it wasn’t just high or just low pressure that increased my pain, but specifically the spikes. At the time it looked like there was a small window of pressure that is ok. A goldilocks zone.
Sometime after this I started on a GLP-1. The pill version. I had heard the side effects could be pretty bad, so I decided to expand my pain app to log side effects as well. Additionally, I was curious to see how much or if the pain reduced as I lost weight. I was still seeing my doctor and specialists through all of this, but referrals in my area are slow. I’m still waiting on someone to call me to schedule a nerve conduction study as I write this.
One of the things that surprised me most was once I added a thumbnail, a prompt came up asking me to “install app” on my phone. It wasn’t an actual app, just an instance of the browser in full screen, with a thumbnail alongside all my actual apps.
Then the scope… well, it got away from me. I spent hours setting up Tasker on my phone, working with Claude to manipulate TaskerHealthConnect into delivering the stats I wanted to collect. Originally I had hoped to gather steps and water intake as well, but for whatever reason Samsung Health decided it would not be sharing those details with Health Connect and I grew tired of trying. The connection is finicky, I hope to improve it one day when I upgrade my watch (I currently have a Samsung Watch 6, old, but not ancient).
I also periodically get migraines – the seeing spots, nauseous, need to reduce all forms of light around me type of migraines. Well, we were here, why not add that metric as well.
Ultimately this is the finished product I landed on. It still looks very Claude like, but utilizes the font and color scheme I requested. The pain button selected is still the trigger event to log an entry, the other fields are all optional. The dosage remains constant unless I change it. When I titrate up to 4mg, I will select the 4mg button and it will remain as the default until I change it.
The history tab is just a history of entries, I will not be showing a screenshot here – I’m sure you can imagine it. If I choose to, I can delete entries from history.
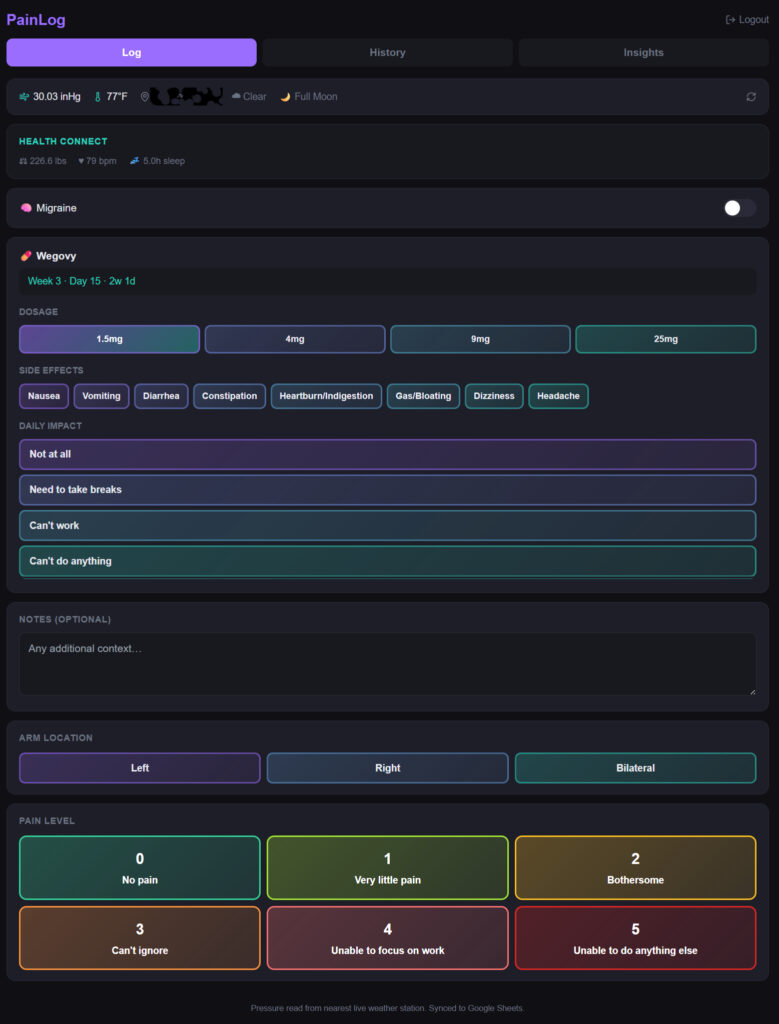
By this point the pain in one arm was occurring in both arms to varying levels of severity, so I took the opportunity to add the designation for which arm.
It took a few weeks for enough data to accumulate to make any interesting observations.
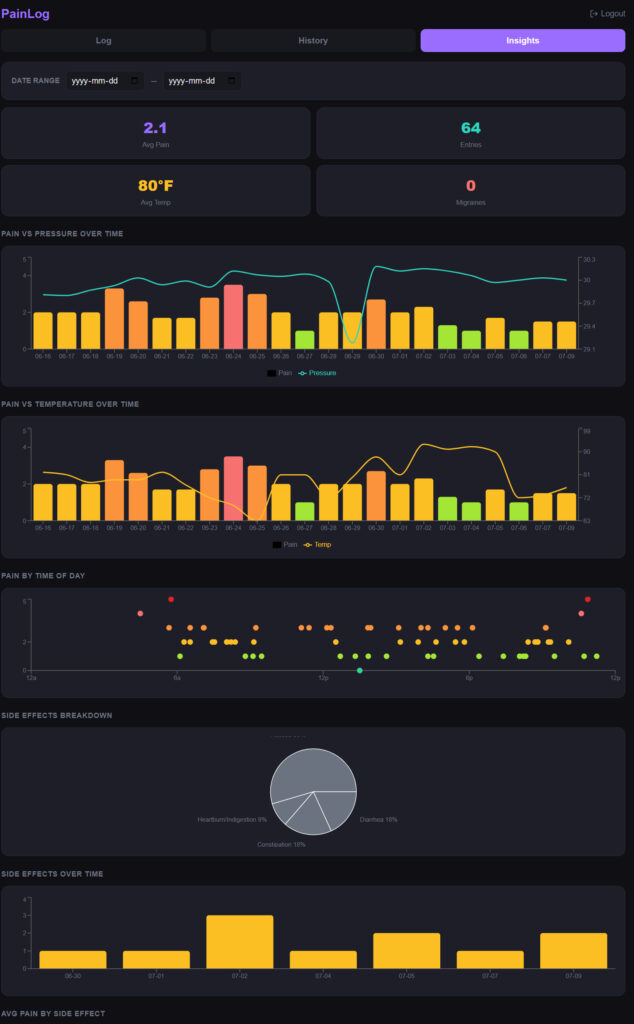
There are more charts, but they aren’t super relevant, just showing this to display what I was looking at.
The biggest revelation came from starting the Wegovy. I began taking it on June 25th. Ever since then my pain levels went from an average of about 3.5/5 to a 2/5. It is still there, and still needs to be dealt with, but that knowledge sent me down a bit of a rabbit hole.
I do not have Type 2 Diabetes, but I do have some kind of neuropathic pain going on. Studies of GLP-1s have shown to sometimes reduce diabetic neuropathy pain, so I can only assume I have swelling in similar areas that has been reduced.
Another stat showed worsening pain at night and in the morning, but with the added data it looked less and less like the correlation with barometric pressure was true, at least not to the extent early data implied.
This is an ongoing project, if I make significant changes or additions I will log them here, in a new post.
I’ve gotten some interest from friends and family to turn this into an app anyone can use. Health data is complicated, so I hesitate to build something that may collect information that may violate HIPAA or similar. In addition, any public version would likely be stripped of the ability to connect to a health app – I had a helluva time getting that to connect for just me, getting it to be something easy for users is beyond my abilities and would likely incur actual costs.
But a basic pain log for public use may be something I create in the future. Users would need to connect their own google sheet to it, so none of their data would live in my database. Something to ideate on as time goes by.
Of course, if you’re a little tech savvy, and have a place to host, you could probably build this yourself using Claude or another capable AI. With Claude, and a bit of a learning/relearning curve, this project took me a total of about 20 hours total – including tinkering and making nit picky changes.